


Wright's Law and Productivity Growth
Wright's Law describes how an organisation's productivity improves as it gains experience with a particular task and may impact the economy at the macro level.

Wright’s Law
Wright’s Law was developed by Theodore Wright in 1936 and appears to be one of the first observations of productivity gained through experience in industry. Wright was an aeronautical engineer who observed that for every doubling of airplane production the unit manufacturing cost decreased in a systematic manner. This increase in productivity with experience is a separate phenomena to economies of scale, although the two are generally closely intertwined and their effects can be difficult to separate.
Wright also observed that the ratio of labour to materials used in manufacturing declined and tool costs became an increasingly large component of total cost as experience increased. This suggests that capital is substituted for labour as experience accumulates, leading to higher fixed costs and lower variable costs. Another observation was that designs tended to become more standardised as experience accrued, leading to a reduced likelihood of expensive changes during the manufacturing process.
Wright segregated improvements into labour, material and overhead categories, although overhead costs are more likely to be related to economies of scale than experience. Wright attributed productivity gains to standardised designs, reduced use of labour, the substitution of unskilled labour for skilled labour, reduced material waste and productivity gains from experience occurring throughout the supply chain resulting in lower input costs.

Figure 1: Wright’s Law (Source: Journal of Aeronautical Sciences)
Moore’s Law
Wright’s Law is probably more familiar to most people in the form of Moore’s Law. Gordon Moore was Intel’s R&D director and in 1965 projected that the number of transistors on a chip would continue to double every two years. It should be noted that Moore’s Law is based on productivity improvements over time, whereas Wright’s Law is based on productivity gained through experience. The two laws generally lead to similar predictions though as demand increases with a decline in costs, leading to increasing production volumes over time.
Based on the observation that the cost per component is nearly inversely proportional to the number of components and that the number of components would increase exponentially, Moore was able to predict a dramatic improvement in chip price and performance that he believed would lead to:
“such wonders as home computers or at least terminals connected to a central computer, automatic controls for automobiles and personal portable communications equipment. The electronic wrist-watch needs only a display to be feasible today.”
Bear in mind that these predictions were made in 1965. Moore’s prediction was based on the number of components per integrated circuit which minimised manufacturing cost per component.
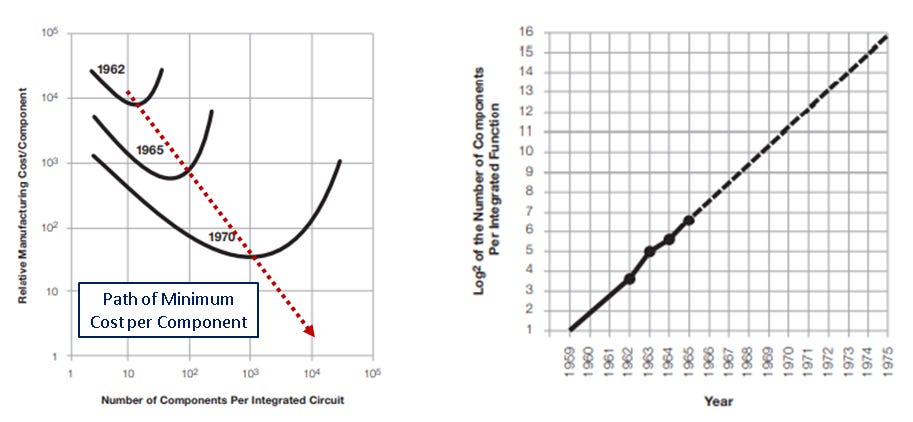
Figure 2: Moore’s Law (source: Intel)
Moore’s Law is somewhat deceptive though as it predicts a constant improvement in productivity over time without consideration of how this productivity improvement is achieved. Economists at Stanford and MIT have calculated that the research effort going into upholding Moore’s Law has risen by a factor of 18 since 1971. The cost of a fab is rising at around 13% a year, and is expected to reach $16 billion or more by 2022. This has lead to a reduction in the number of companies manufacturing next generation chips, from 25 in 2002 to only three in 2020. In comparison, Wright’s Law explicitly captures this decline in return on investment in productivity growth through the cumulative experience relationship.
The Experience Curve
Boston Consulting Group helped bring Wright’s Law to the main stream with their work on The Experience Curve and the BCG Growth-Share Matrix. The phrase experience curve was proposed by Bruce Henderson based on analyses of cost behaviour in the 1960s. The Experience Curve expresses a linear relationship between the log of cumulative production volume and unit costs, the same relationship as Wright’s Law. BCG believed that achieving a cost leadership position was a powerful competitive advantage that companies should pursue by becoming market share leaders. It was also suggested that cost savings be passed on to customers to discourage competitors from trying to gain market share.
The Experience Curve lead to the BCG Growth-Share Matrix, a portfolio management framework used to help guide companies on how they should prioritise different businesses. A business’ market share and the growth rate of the market determine how attractive the business is. Businesses with high market shares are more likely to be profitable than businesses with low market shares. Businesses in high growth markets are likely to require investments to drive growth, leading to negative cash flows. Businesses in low growth markets likely have minimal investment requirements, leading to positive cash flows.
Cash cows are businesses with a large share in a low growth market. They are likely to produce positive cash flows which can be invested in other businesses or returned to shareholders.
Stars are businesses with a large share in a high growth market. They are likely to result in negative cash flows due to their investment requirements.
Dogs are businesses with a small share in a low growth market. These businesses should be divested as they are likely at a strategic disadvantage and the market is not attractive.
Question marks are businesses with a small market share in a high growth market. These businesses are at a strategic disadvantage but the market is attractive. If the business can gain sufficient market share to be cost competitive it may be worthwhile investing in.
This is a framework that should primarily be applied to commodity markets where achieving the lowest costs is an advantage.

Figure 3: BCG Growth-Share Matrix
The Learning Curve
The Learning Curve is an observation of individual performance on a task as experience with the task increases. The Learning Curve was first observed in 1885 by the German psychologist Hermann Ebbinghaus based on memorisation of verbal stimuli. Later work in human memory found this relationship to generalise with more experience in a task leading to better performance. A similar phenomena is observed in machine learning where improvements in model performance decline with increasing volumes of data. While The Learning Curve is similar to Wright’s Law and improvements at the individual level may contribute to Wright’s Law somewhat, these are separate phenomena. The Learning Curve is the result of an individual’s skill improving with experience, whereas Wright’s Law is the result of process improvements at the organisation level.

Figure 4: Example Learning Curve
Examples
Despite the common belief that exponential improvements in productivity is a phenomenon largely confined to the tech industry, it is actually common across industries.

Table 1: Example Cost Declines with Experience
Causes
There are likely a number of factors which contribute to productivity gained through experience, the importance of which varies between cases. These factors can be broken into:
Improving the productivity of labour
Improving the productivity of capital
Reducing material costs
Reducing labour costs
Improved Productivity of Labour
As workers gain experience with a task they become more competent at that task, particularly if specialization allows employees to build experience on a particular task. I do not believe this is an important driver of productivity gains though as there is a limit to human performance at a task and employee turnover will limit the experience of employees.
Improved Productivity of Capital
The productivity of capital can be increased by improving the design of tools and improving processes. Improvements in machinery may increase throughput and utilisation or reduce material and labour requirements.
Reduced Material Costs
Design improvements may reduce material requirements and process improvements can reduce material waste. Productivity gained through experience is likely to occur throughout the supply chain, leading to lower input costs. The mix of input materials can also be changed to lower costs.
Reduced Labour Costs
Standardisation of processes and improved tooling allows unskilled labour to be substituted for skilled labour, leading to a reduction in labour costs. Tasks can also be automated, resulting in a substitution of capital for labour. This is probably the primary driver of productivity gains in the long run as productivity becomes dependent on engineering better equipment and processes rather than human performance.
The contribution of input material costs and labour costs to total costs and the extent to which capital can be substituted for labour are likely large determinants of how quickly costs decline and the limit to which they can decline. If raw material and labour costs are large contributors to total cost and capital cannot be substituted for labour, then productivity gains will likely be low.
Deflation
Wright’s Law can be a significant driver of deflation in competitive markets as rapid improvements in productivity lead to declining costs. This is somewhat hidden in inflation data which aggregates inflation of a basket of goods and services, but can be clearly seen in granular inflation data. Goods and services which lend themselves to automation and the substitution of capital for labour have seen flat or declining prices in recent decades. Services which have a large labour component that is not automatable and highly regulated goods and services have seen relatively rapid inflation in recent decades. In the absence of structural inflation from demographic factors, inflation is likely to remain weak due to increasing productivity, particularly if higher productivity can be brought to areas like housing, education and healthcare.
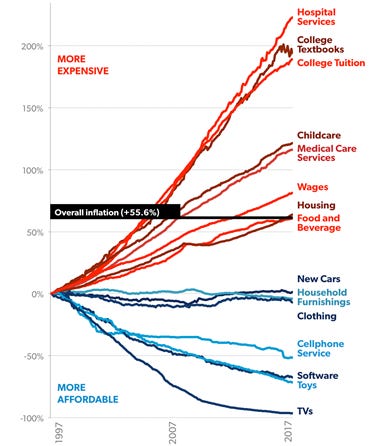
Figure 5: U.S. Inflation by Category (source: marketwatch)
Conclusion
Productivity gained through experience is a common phenomena, whether at the individual level as described by The Learning Curve or at an organisation level as described by Wright’s Law. Wright’s Law shows that productivity gained through experience is highly predictable and as improvements compound, leads to dramatic increases over time.
Productivity gains can lead to deflation but this is a positive as it increases consumer buying power without reducing corporate profits. This is in contrast to deflation which is the result of erosion of corporate profits, which over time will weaken the economy.
There are likely a range of factors which contribute to Wright’s Law, but the primary one appears to be the standardisation and automation of tasks, allowing capital to be substituted for labour. Tasks which have a large labour component that cannot currently be automated are likely to achieve minimal productivity gains with experience. A combination of varying rates of productivity gains and market forces leads to rapid deflation in some parts of the economy and relatively rapid inflation in other parts of the economy.